I don't know about you, but... wait, yes I do.... report card time is the busiest in all our lives as teachers. Have I given all the assessments I need and has every student been assessed? How am I going to keep track of my assessment scores and what will be the criteria for report card marks? This is a bittersweet feeling of some serious anxiety and some butterflies-flapping-in-stomach anticipation for all of the fun organization to be had! (Serious dorkery, I'll be honest).
So to no surprise, I found technology to be the answer to all my report card needs. Since our job has teachers has basically turned into data managers, Google Drive is a must.
In this post, I'm going to be discussing how I use "The Drive" (most specifically, Google Sheets) to keep track of all my kindergarten data! :)
Ready, here we go:
1. Template Structure: Using Google Sheets, make a template of what an individual student report card looks like:
 |
| Individual Report Card Template |
I can't stress enough the importance of a TEMPLATE first. Don't start inputting data for an individual student- You need to have a complete blank copy that you can make copies of for each student.
- Column A has the skills listed in order the appear on the report card by subject area.
- Column B has the assessments used for each skill (Some of the assessments I made as a link, so that clicking on it will take you to the assessment. This is especially helpful if the template is shared with your teammates! You all know you are using the same assessment and you can all access it in the same place- I can't tell you how many times my team has found that we have several different versions of assessments in our binders!)
- Columns C, D, and E are for each trimester of the year. Obviously you can change this so that it is for your own school's grading periods (semesters, quarters, etc.)
- I made solid black rows in between each subject area set of skills so that it was visually easy to see. All you have to do is highlight the cells in the row and change the fill color to black.
3. Data Validation: This is the coolest part-- drop down menus! Click on the cell(s) that you would like to have drop down options for. Go to "Data" and then "Validation"
 |
| Data Validation |
- Go to "Criteria" and choose the type of criteria you would like to have for your data. I chose "List of Items" to have a drop-down menu. This works best when there are only a few options for what the student could have scored or if it is a developmental/diagnostic stage. Then, in the box, I typed all the different options I wanted to be included in the drop-down menu separated by a comma.
- If invalid data is attempted in the cell (for example, you accidentally type a number in the cell as you are recording student data), you have the option of the technology to either show a pop-up warning that it is not one of the data criteria you chose, or it can simply reject the input altogether (not allowing whatever it is you typed in the cell to appear).
- Press Save. You will know it's worked when you see a little arrow in the cell. Clicking on the arrow, you will find your drop down menu and the options you have to choose.
 |
| Drop Down Menu For Data Criteria |
4. Conditional Formatting: Our report card only has three possible marks ("Beginning," "Developing," "Secure). I color coded the spreadsheet so that red data= beginning, yellow data=developing, and green data=secure. Conditional Formatting is where you can format the cell(s) to automatically appear a certain way based on conditional rules you have created. After selecting the cell(s) you want with formatting rules, go to the Format menu and select Conditional Formatting.
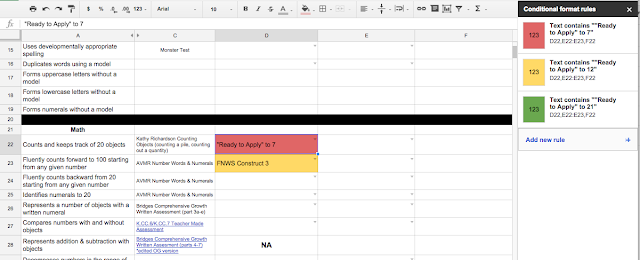 |
Conditional Formatting Rules
|
- A menu on the right side will appear. As you can see, I have my red, yellow, green (beginning, developing, secure) formatting rules. This particular skill has a drop down menu with text that are developmental stages, so I made the rules based on the text contained in the cell
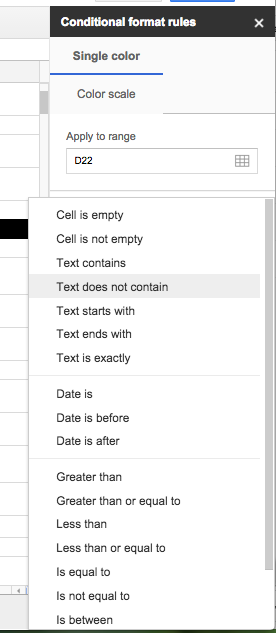 |
| Choose the type of content the cell will format |
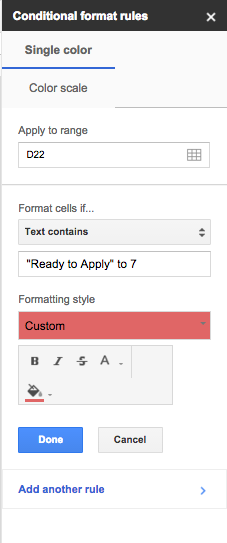 |
| Choose the formatting style (color, bold, fill, etc.) |
- Add as many rules as you need to make each possible inputted score fall under each of the possible report card marks or grades. Just make sure the rules do not conflict with one another.
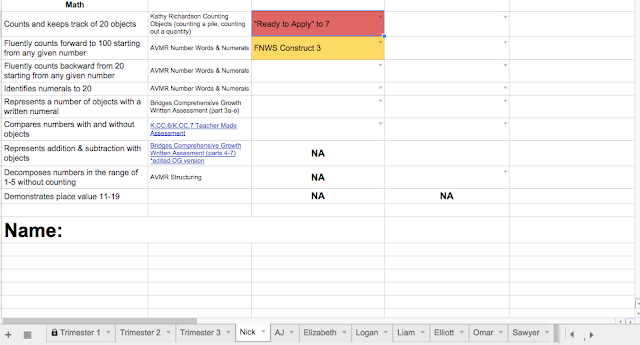 |
| Each student has a tab with their own report card template |
5. Individual Student Tabs: Once the template for the individual report card is finished, it's time to duplicate the sheet for each student.
Clicking on the downward arrow on the tab at the bottom, select "duplicate." This will cause another tab to appear right beside the original with the exact same spreadsheet. You will need to do this for each student and you will want to have at least one extra tab that remains blank in case you get more students.
- For printing purposes, I usually include a space in the template for the student's name on the actual spreadsheet.
Now it's time to start inputting assessment scores! Looking at your completed color-coded spreadsheets will make it so much easier to visually see how each student is doing and what assessments they may have missed and need to make up. I can fill out report cards lickety-split simply by looking at color! Simultaneously, I can see the scores for more detail about the student's performance, which I can use in report card comments or parent-teacher conferences!
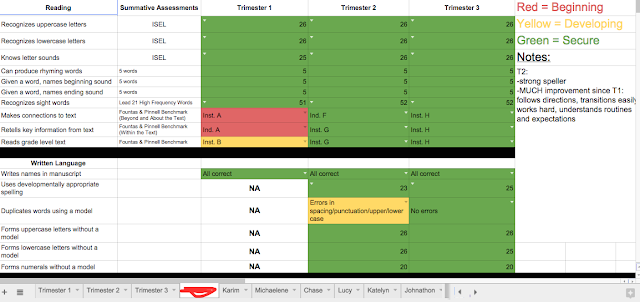 |
| Here is an example of a student report card from last year |
Print out for easily filling out report cards, or keep on the computer to glance at during conferences! Enjoy!
How do you keep all your grades organized??? I'd LOVE (no seriously, I'm obsessed with this kind of stuff) to know!
Thanks for stopping by! :) :)
Want to see how I then have this data automatically transposed into a spreadsheet by class view per trimester? Comment below and I will be sure to add another post!
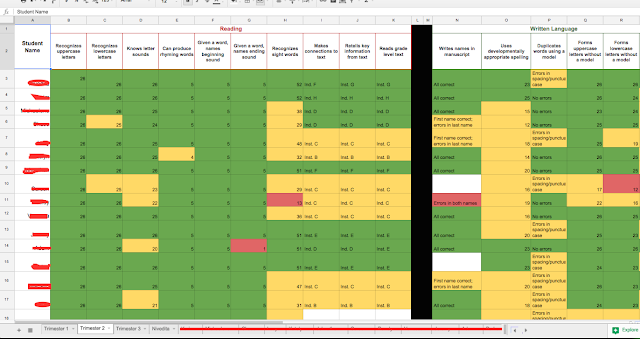 |
| Student Assessment Data (Class View) |


